December 18, 2017 / by Sergey Kapustin
Adc Auto Trigger Median Filter Analysis
Have you thought of how to filter the data coming from an analog sensor? In this post, I describe:
- Problem with sensor measurements
- Way to auto-trigger analog data collection
- Median and mean filter application
- Analysis of sample data
On YouTube
Problem
In the following snapshot, the ladder-like trace, shows a signal from Sharp 10-80 centimetre infrared sensor. I was waving my hand in front of it:
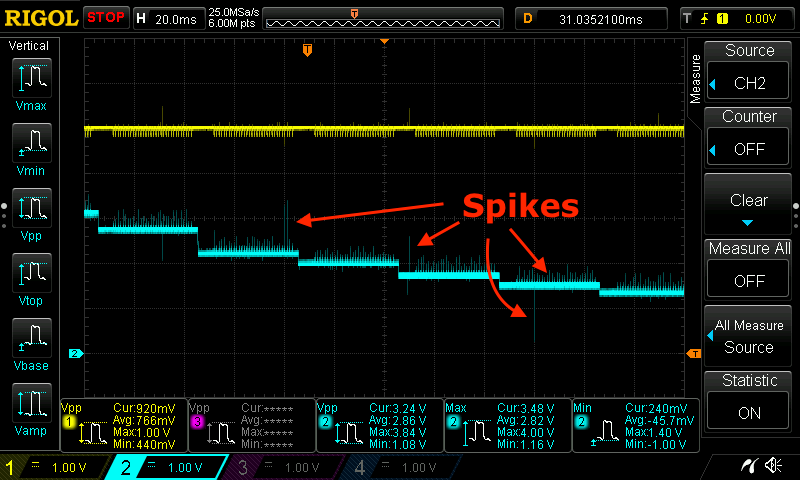
As the trace shows, the sensor spends about 40mS to take a measurement. The data sheet for the sensor specifies 38.3mS +/- 9.6mS, which is about the same.
If my code reads analog value from the sensor once every 50mS, the reading may come from one of the spikes. So, when that value is converted into a distance, the distance representation will not be accurate. As is the case with the first spike in the image, the sample will represent the distance from two measurements ago, which is bad.
A common approach to improve the accuracy is to take multiple measurements and compute the average. But which one, mean or median? Later, I’ll show you the comparison between all three when measuring the distance to a fixed point.
Auto-Triggering Data Collection
To read an analog value, one can use Arduino’s analogRead() function. When calling it from a main loop, the CPU is tied up while collecting the samples necessary to compute the average. This may pose a problem because other important tasks are put on hold while this read-and-wait cycle executes:
1
2
3
4
5
6
7
8
9
10
11
12
13
14
define IR_PIN       A9
define SAMPLE_COUNT 10

void loop() {
    int values[SAMPLE_COUNT] = {0};

    for (int i = 0; i < SAMPLE_COUNT; ++i) {
        values[i] = analogRead(IR_PIN);
        delay(10);
    }

    // Compute average...
    // Important tasks here are waiting...
}
A better approach is to collect the samples in ADC completion interrupt, which ADC calls when it completes converting voltage level to a digital value:
1
2
3
4
5
6
7
8
9
ISR(ADC_vect) {
    // ADC conversion is complete, store the ADC value.
    g_AdcChannels[g_AdcChannelIdx].push(ADC);

    // Poll the next channel. Make sure the timer for
    // ADC trigger fires up with greater interval than it takes
    // to poll all analog channels.
    pollNextAdcChannel();
}
ADC can operate in free-running mode, which is ok if I have a single analog sensor. With multiple sensors, the timing of reading data from different sensors can be challenging to code properly. Therefore, I chose to trigger the ADC using a timer:
1
2
3
4
5
6
7
8
9
10
11
12
13
14
15
16
17
18
19
20
21
22
23
24
25
26
27
28
29
30
31
32
33
34
35
36
37
volatile bool g_Update = false;

void initTimers() {
    // Clear and set timer to CTC mode. When TOP is at OCRnA
    // use WGMn2, mode 4 (See p.145)
    TCCR2A = 0;
    TCCR2B = 0;
    TCCR2A |= (1 << WGM21);

    // Set prescaler 64 (p.185)
    TCCR2B |= (1 << CS22);
    OCR2A = 250;

    // Enable interrupt
    TIMSK2 |= (1 << OCIE2A);
}

ISR(TIMER2_COMPA_vect) {
    // This interrupt is called every 1mS. Do actions according
    // to the plan:
    // 1. Poll ADC channels every 10mS
    // 2. Send updates every 50mS
    //
    static uint32_t counter = 0;

    if ((counter % ADC_FREQ) == 0) {
        pollNextAdcChannel(0);
    }

    // Increment the counter here because there is nothing to
    // update with at "time" 0.
    ++counter;

    if ((counter % UPDATE_FREQ) == 0) {
        g_Update = true;
    }
}
Since IR distance measurement takes 50mS, and I want to average over 5 samples, the timer interrupt routine is configured to initiate ADC conversion every 10mS (ADC_FREQ = 10).
At this point, I’m set up with a single analog sensor. But when I add more in the future, the function below will instruct ADC to sample from all configured sensors in turn:
1
2
3
4
5
6
7
8
9
10
11
12
13
14
15
16
17
18
19
20
21
22
23
24
25
26
27
28
29
#define ADC9            0b100001
#define AVG_SAMPLES     5

volatile uint8_t g_AdcChannelIdx = 0;

typedef ut::ValueTracker<uint16_t> TrackerType;

TrackerType g_AdcChannels[] = {
    TrackerType(AVG_SAMPLES, ADC9)
};

void pollNextAdcChannel(uint8_t step = 1) {
    const uint8_t count = sizeof(g_AdcChannels) / sizeof(TrackerType);

    g_AdcChannelIdx += step;

    if (g_AdcChannelIdx < count) {
        ADCSRA |= (1 << ADEN);
        ADMUX = (0xE0 & ADMUX) | (0x1F & g_AdcChannels[g_AdcChannelIdx].id());
        ADCSRB = ((g_AdcChannels[g_AdcChannelIdx].id() >> 5) << 3);
        ADCSRA |= (1 << ADSC);
    } else {
        // Next time ADC is enabled, the first conversion will take
        // 25 ADC clock cycles instead of 13. But by enabling and
        // disabling ADC, we save power.
        ADCSRA &= ~(1 << ADEN);
        g_AdcChannelIdx = 0;
    }
}
Every 50mS, the code in the main loop will compute the average and send the data out for analysis:
1
2
3
4
5
6
7
8
9
void loop() {
    if (g_Update) {
        g_Update = false;

        Serial.print(millis());
        Serial.print(",");
        Serial.println(g_AdcChannels[0].median());
    }
}
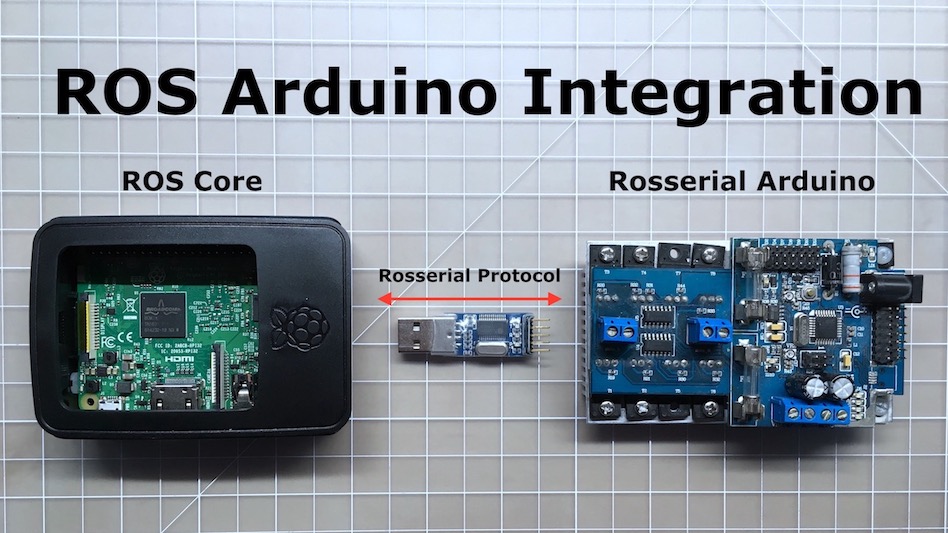
ROS and Arduino
In the example above, Arduino sends messages using Serial.print().
In my previous post (“Integration of ROS and Arduino”), I investigated how to use ROS to publish “hello world” messages from the Arduino. My plan was to use ROS in this example as well. The idea was to publish an array of sensor values. The actual procedure of creating an array is a bit involved:
1
2
3
4
5
6
7
8
9
10
11
12
13
14
15
16
17
18
    UInt16MultiArray g_SensorVals;

    // The following code may cause "lost sync with device...".
    // See https://answers.ros.org/question/10988/use-multiarray-in-rosserial/
    //
    //g_SensorVals.layout.dim_length = 1;

    g_SensorVals.layout.dim =
        (std_msgs::MultiArrayDimension *) malloc(
                sizeof(std_msgs::MultiArrayDimension));
    g_SensorVals.layout.dim[0].label = "";
    g_SensorVals.layout.dim[0].size = SENSOR_COUNT;
    g_SensorVals.layout.dim[0].stride = sizeof(uint16_t);
    g_SensorVals.layout.data_offset = 0;

    g_SensorVals.data_length = SENSOR_COUNT;
    g_SensorVals.data =
        (uint16_t*)malloc(sizeof(uint16_t) * SENSOR_COUNT);
The code didn’t work at first go. While waiting for ROS message board to come out of maintenance, I had time to take a look at the design of ROS2. That changed my plans of using ROS on Arduino.
In ROS2, the messaging will be replaced with the Data Distribution Service (DDS). As far as I know, there is no DDS software for AVR hardware. From my experience, DDS is quite rich in features and provides everything one could ever want from a middleware. For more capable hardware, DDS is awesome unless I have to pay an arm and a leg for those features.
Another change ROS2 plans to make is to move from catkin build system to something called “ament”.
With all of that, more time investment in ROS1 is not as appealing. But, I look forward to all the goodness in ROS2.
Filtering
Filtering code is straightforward:
1
2
3
    ...
    Serial.println(g_AdcChannels[0].median());
    ...
To compute the median, sensor samples are sorted first:
1
2
3
4
5
6
7
8
9
10
11
12
13
14
template<typename T>
inline void Sorters::insertionSort(T* arr, uint32_t size) {

    for (uint32_t i = 1; i < size; i++) {
        uint32_t j = i;

        while (j > 0 && arr[j - 1] > arr[j]) {
            T tmp = arr[j];
            arr[j] = arr[j - 1];
            arr[j - 1] = tmp;
            j--;
        }
    }
}
Then the middle value is read from the sorted array:
1
2
3
4
5
6
7
8
9
10
11
12
13
template<typename T>
inline T ValueTracker<T>::median() const {
    T arr[count_] = {0};
    memcpy(arr, vals_, count_ * sizeof(T));

    Sorters::insertionSort(arr, count_);

    if ((count_ % 2) != 0) {
        return arr[count_ / 2];
    } else {
        return (arr[count_ / 2] + arr[(count_ / 2) - 1]) / 2;
    }
}
To compare the data between single-value, median and mean, I modified the code for each scenario and printed the data separately. All three could also be computed and output at the same time.
Analysis
Once a python script, which runs on my desktop, receives and stores the data in a CSV file:
1
python3 scripts/print_serial.py > data/stats_ir_us_mean.csv
the data is then loaded into pandas for analysis:
1
2
3
4
5
6
7
8
9
10
11
12
13
14
15
16
17
18
19
20
21
22
23
24
25
26
27
28
29
30
31
32
33
34
35
36
37
38
39
40
41
Python 3.6.3 (default, Oct  4 2017, 06:09:15)
Type 'copyright', 'credits' or 'license' for more information
IPython 6.2.1 -- An enhanced Interactive Python. Type '?' for help.

In [1]: n = ['Time', 'US', 'IR']

In [2]: df = [pd.read_csv('data/stats_ir_us_single.csv', header=None, names=n),
   ...:       pd.read_csv('data/stats_ir_us_mean.csv', header=None, names=n),
   ...:       pd.read_csv('data/stats_ir_us_median.csv', header=None, names=n) ]
   ...:
In [3]: [df[i].describe().loc[:,'IR'] for i in range(0,3)]
Out[3]:
[count    375.000000
 mean     134.760000
 std        8.331437
 min      131.000000
 25%      132.000000
 50%      132.000000
 75%      132.000000
 max      164.000000
 Name: IR, dtype: float64,

 count    398.000000
 mean     135.025126
 std        5.137835
 min      131.000000
 25%      132.000000
 50%      132.000000
 75%      138.000000
 max      150.000000
 Name: IR, dtype: float64,

 count    317.000000
 mean     133.318612
 std        4.544722
 min      132.000000
 25%      132.000000
 50%      132.000000
 75%      133.000000
 max      161.000000
 Name: IR, dtype: float64]
- In the first case, the code sampled 1 value every 50mS and printed that value for the total of 375 values
- In the second case, the code sampled 1 value every 10mS, calculated arithmetic mean after collecting 5 samples, and printed that mean to the total of 398 values
- In the third case, the code sampled 1 value every 10mS, calculated a median after collecting 5 samples, and printed that median to the total of 317 values
Each value represents a distance from the sensor to a fixed object on ADC scale (a range between 0 and 1023 for a 10-bit ADC).
The results show that in each case the median value is 132, which is the expected value. Values are spread the least in case of the median filter. Its mean is also closer to the median.
A density plot shows the situation a little better:
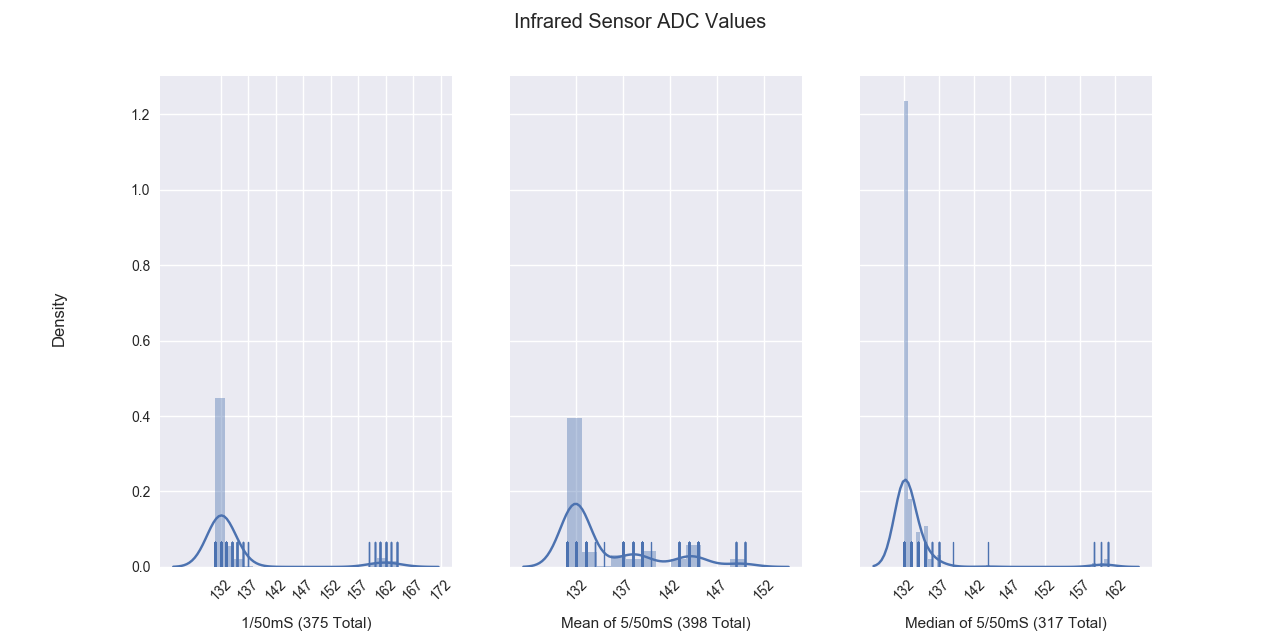
Single-sample and mean filters show bigger variation between the values then the median filter. It shows the most frequent occurance of the expected value.